Log search, health alerts and Postgres insights
A rebuilt monitoring experience with longer history, searchable logs, alerts to email or Slack, and a Postgres Insights tab.
Metrics
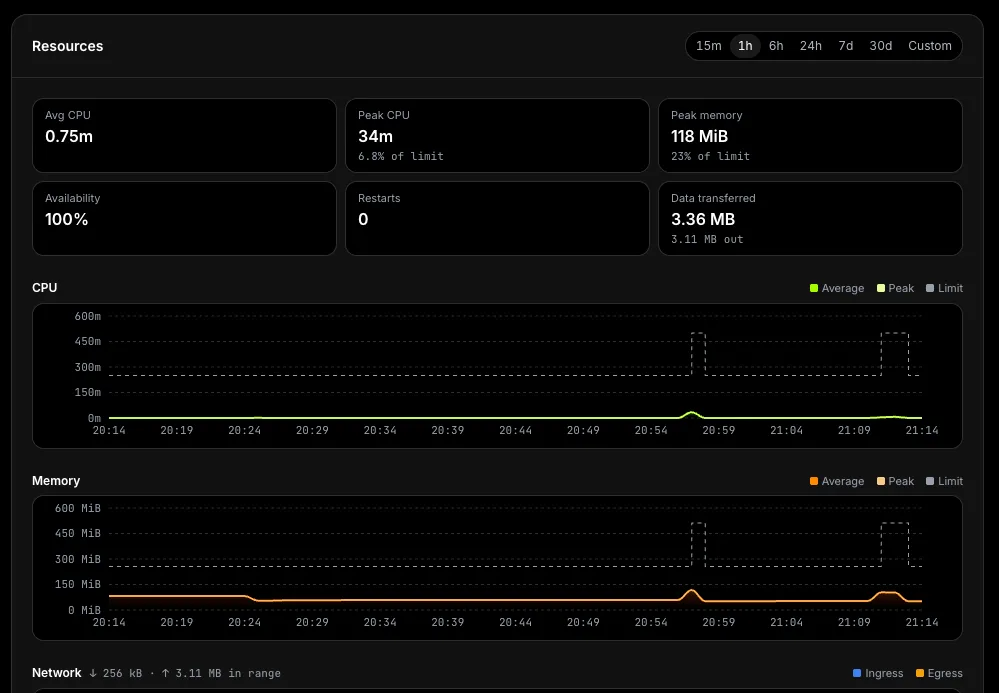
The Resources tab shows ranges from 15 minutes to 30 days, with summary tiles for average and peak CPU, peak memory, availability, restarts and data transferred. CPU and memory draw the peak as a thin line over the average, and the bars now use the service’s real limits.
Logs
Search logs and filter by level on the server, follow or pause the stream, and download what you see as plain text. A histogram above the list shows log volume by level; click a bar to jump to that moment.
Alerts
Health alerts and monitoring rules are delivered to your project’s email and Slack channels. Turn them on with the Health alerts switch (Pro).
Postgres insights
Self-hosted PostgreSQL databases get an Insights tab with connections, size, cache hit ratio, running queries, top queries and table health.
Read more in Monitoring.